Flywire (FLYW)·Q4 2025 Earnings Summary
Flywire Surges 22% After Strong Q4 Beat and FY26 Guidance
February 24, 2026 · by Fintool AI Agent
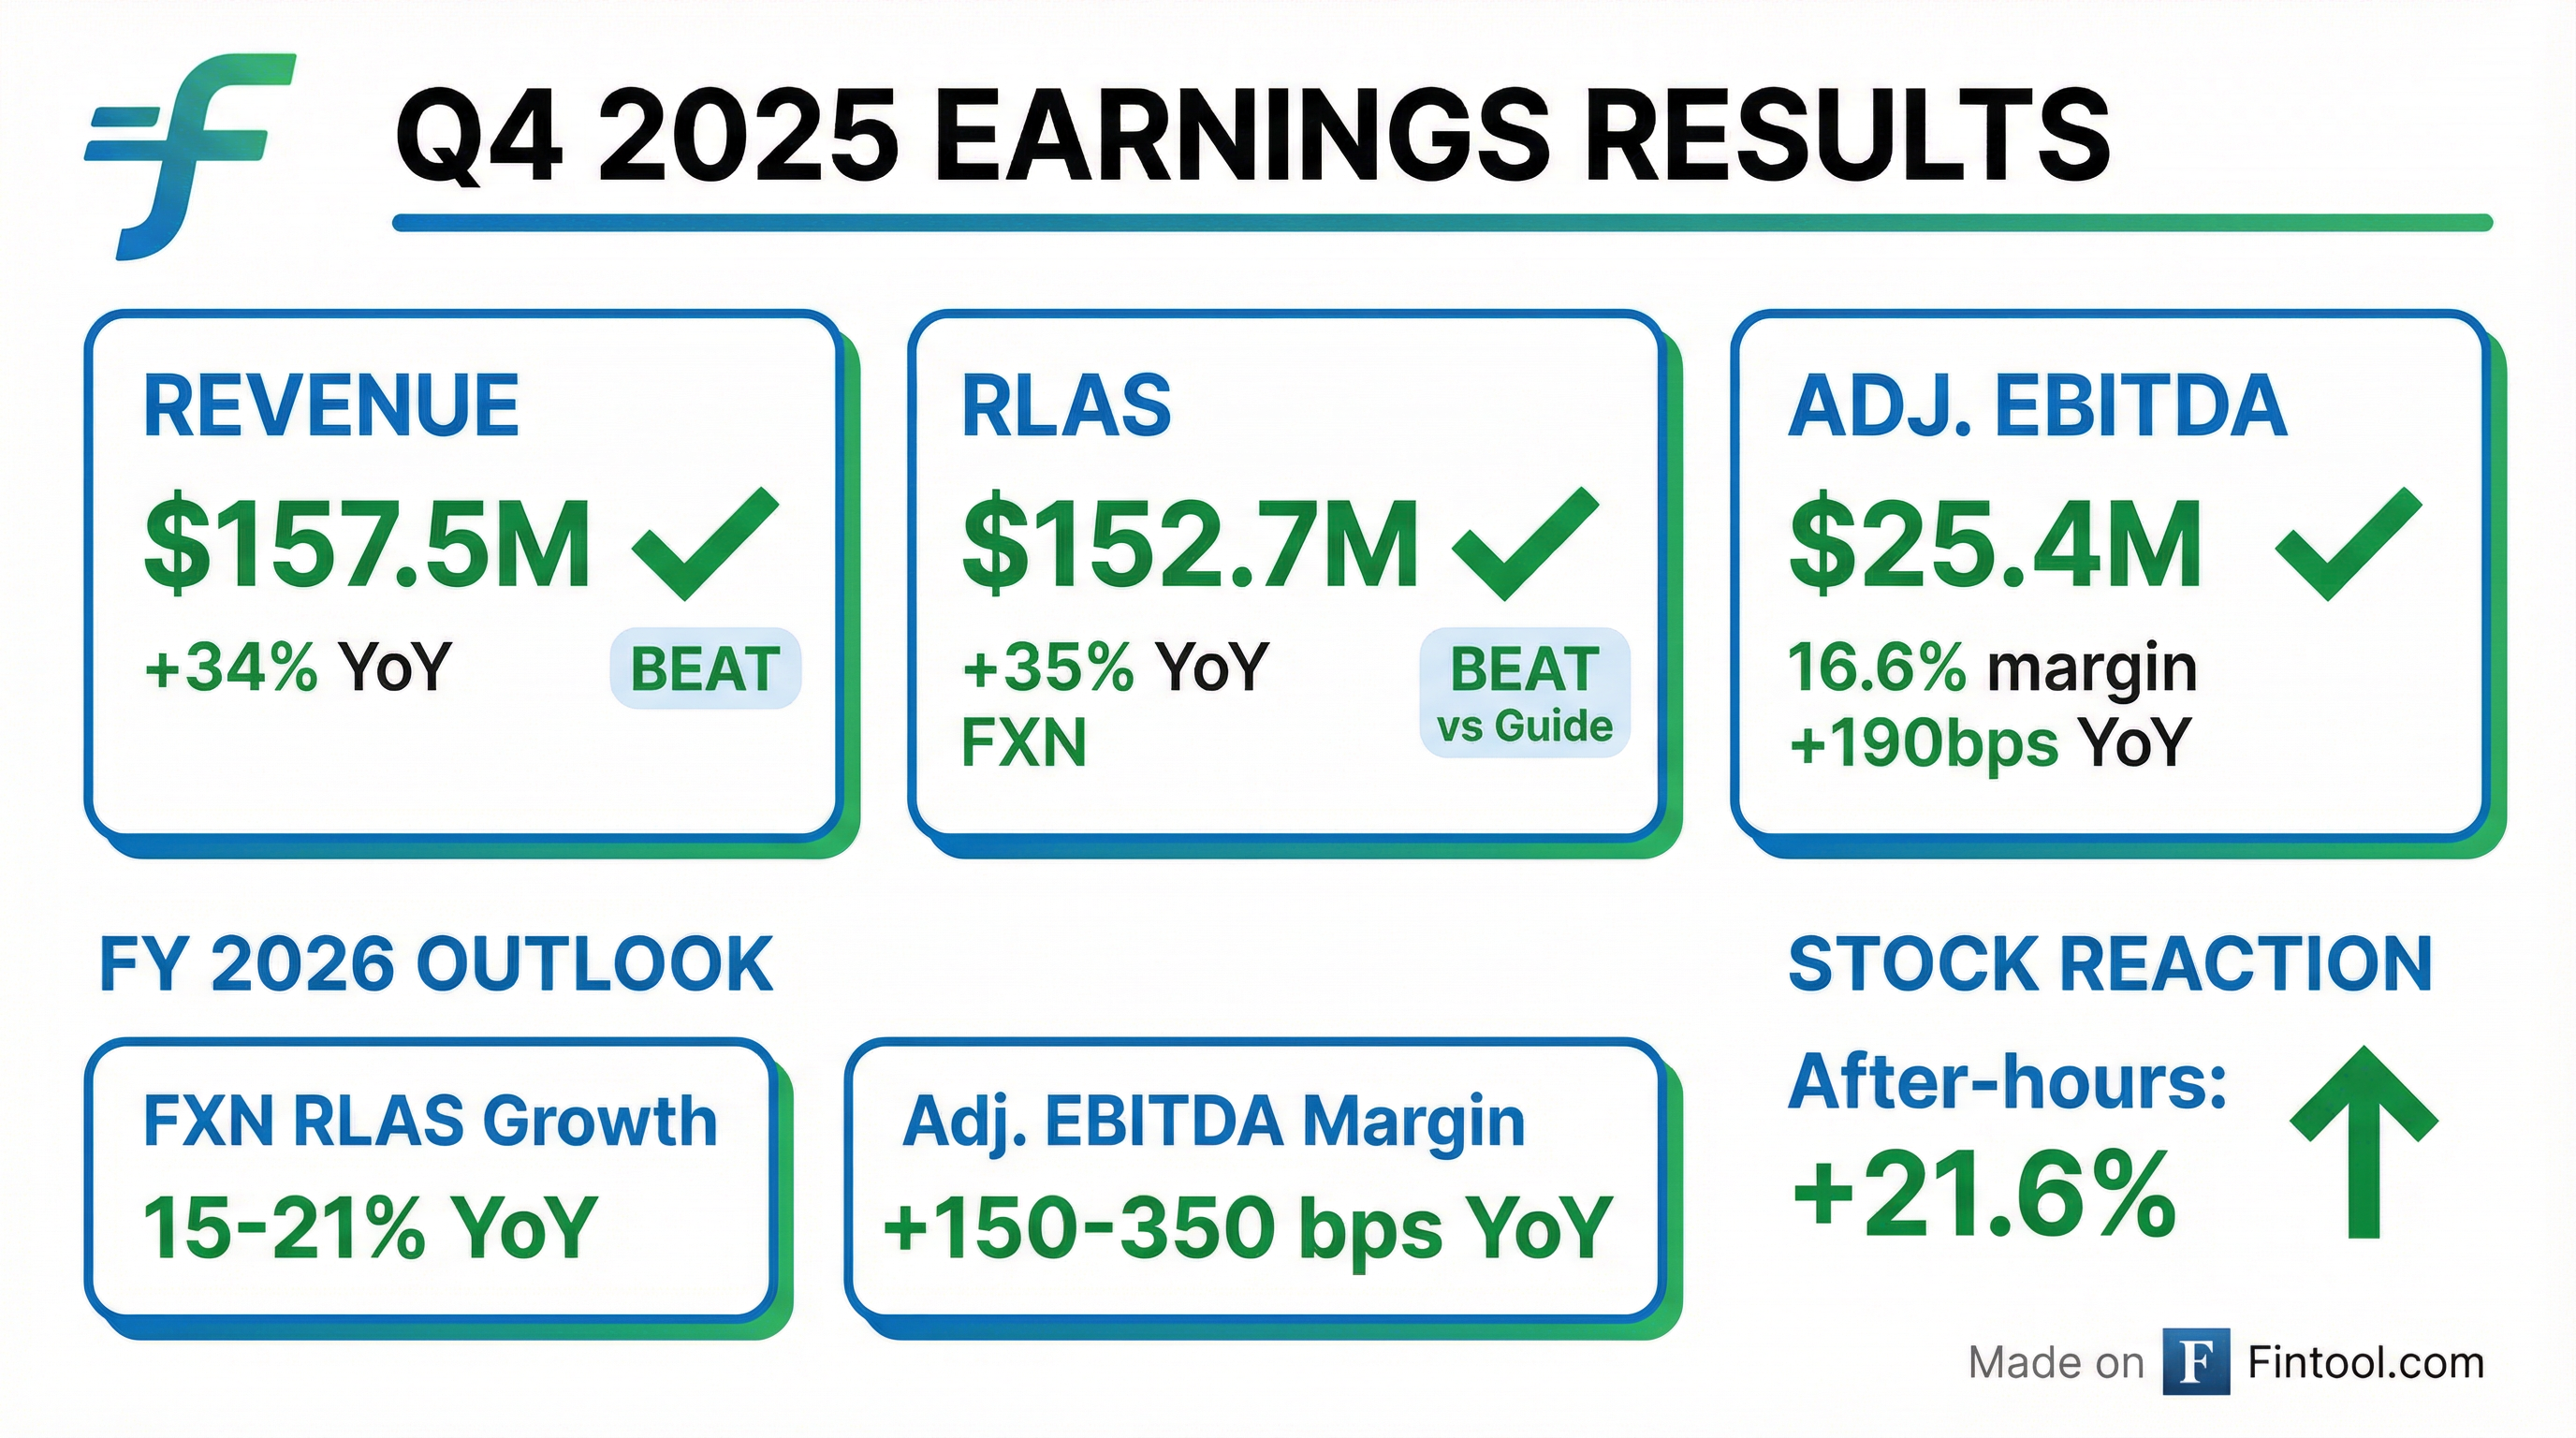
Flywire (NASDAQ: FLYW) delivered a strong beat across all key metrics in Q4 2025, driving shares up 22% in after-hours trading to $12.94. Revenue Less Ancillary Services (RLAS) of $152.7M exceeded guidance by 5.3%, while Adjusted EBITDA of $25.4M beat by over 10%. Management highlighted disciplined execution and structural operating leverage as key drivers, guiding to 15-21% FX-neutral RLAS growth for FY 2026 with continued margin expansion.
Did Flywire Beat Earnings?
Yes — decisively. Flywire beat Q4 2025 guidance on every metric that matters:
The outperformance was broad-based: Healthcare and B2B payment processing ramp exceeded expectations, while Education headwinds from Canada (-30% visa decline) and Australia proved less severe than feared.
Q4 2025 Financial Summary
Sertifi (acquired in early 2025) contributed $14.2M in Q4 revenue, adding 12 points of growth year-over-year. Excluding Sertifi, organic RLAS growth was still 20.1% FX-neutral.
What Did Management Guide?
Flywire provided FY 2026 guidance that implies continued momentum with embedded conservatism around macro uncertainties:
Key guidance assumptions:
- US visas: Down 30%
- Canada visas: Down 10%
- UK visas: Flat
- Australia visas: Flat (watching tighter requirements for Indian students)
- US Education revenue: Low single-digit growth
- Canada Education: >10% growth despite visa headwinds
- Gross margin: Expected to decline 200-300 bps due to payment processing ramp; exiting 2027 in the normal 100-200 bps annual range
CFO Cosmin Pitigoi emphasized the outlook reflects "continued durable demand across verticals, disciplined cost management, and structural operating leverage embedded in the platform" while maintaining prudence given macro uncertainty.
How Did the Stock React?
FLYW shares surged following the results:
The stock has been volatile around earnings over the past year, with several post-earnings drops despite beats (Q2 2024: -12%, Q2 2025: -15%). This quarter's reaction was notably positive, likely driven by:
- Clean beat across all metrics vs guidance
- FY26 guidance that exceeded investor expectations
- Margin expansion trajectory intact despite gross margin mix shift
- Debt payoff — remaining $15M Sertifi acquisition debt repaid
What Changed From Last Quarter?
Several meaningful developments since Q3 2025:
Leadership Changes
- Patrick Blanc appointed CTO (former Visa Value-Added Services CTO and PayPal GM), bringing expertise in scaling global payments infrastructure
- David King transitioned from CTO to Chief Product Officer and Co-President of Global Education
- New Chief Commercial Officer position created
Business Highlights
- Achieved "Workday Certified" status for Global Payments and SFS, removing technical barriers to enterprise adoption
- Added stablecoin (digital currency) capabilities to payment network
- Expanded WeChat Pay partnership with TenPay for Chinese students in South Korea and Malaysia
- Oracle Fusion integration to unlock UK education market growth
Capital Allocation
- Repurchased ~0.7M shares for ~$10M in Q4 2025
- ~8M shares repurchased since program start at average price of $14.75
- $182M remaining in $300M share repurchase authorization
Revenue Diversification Story
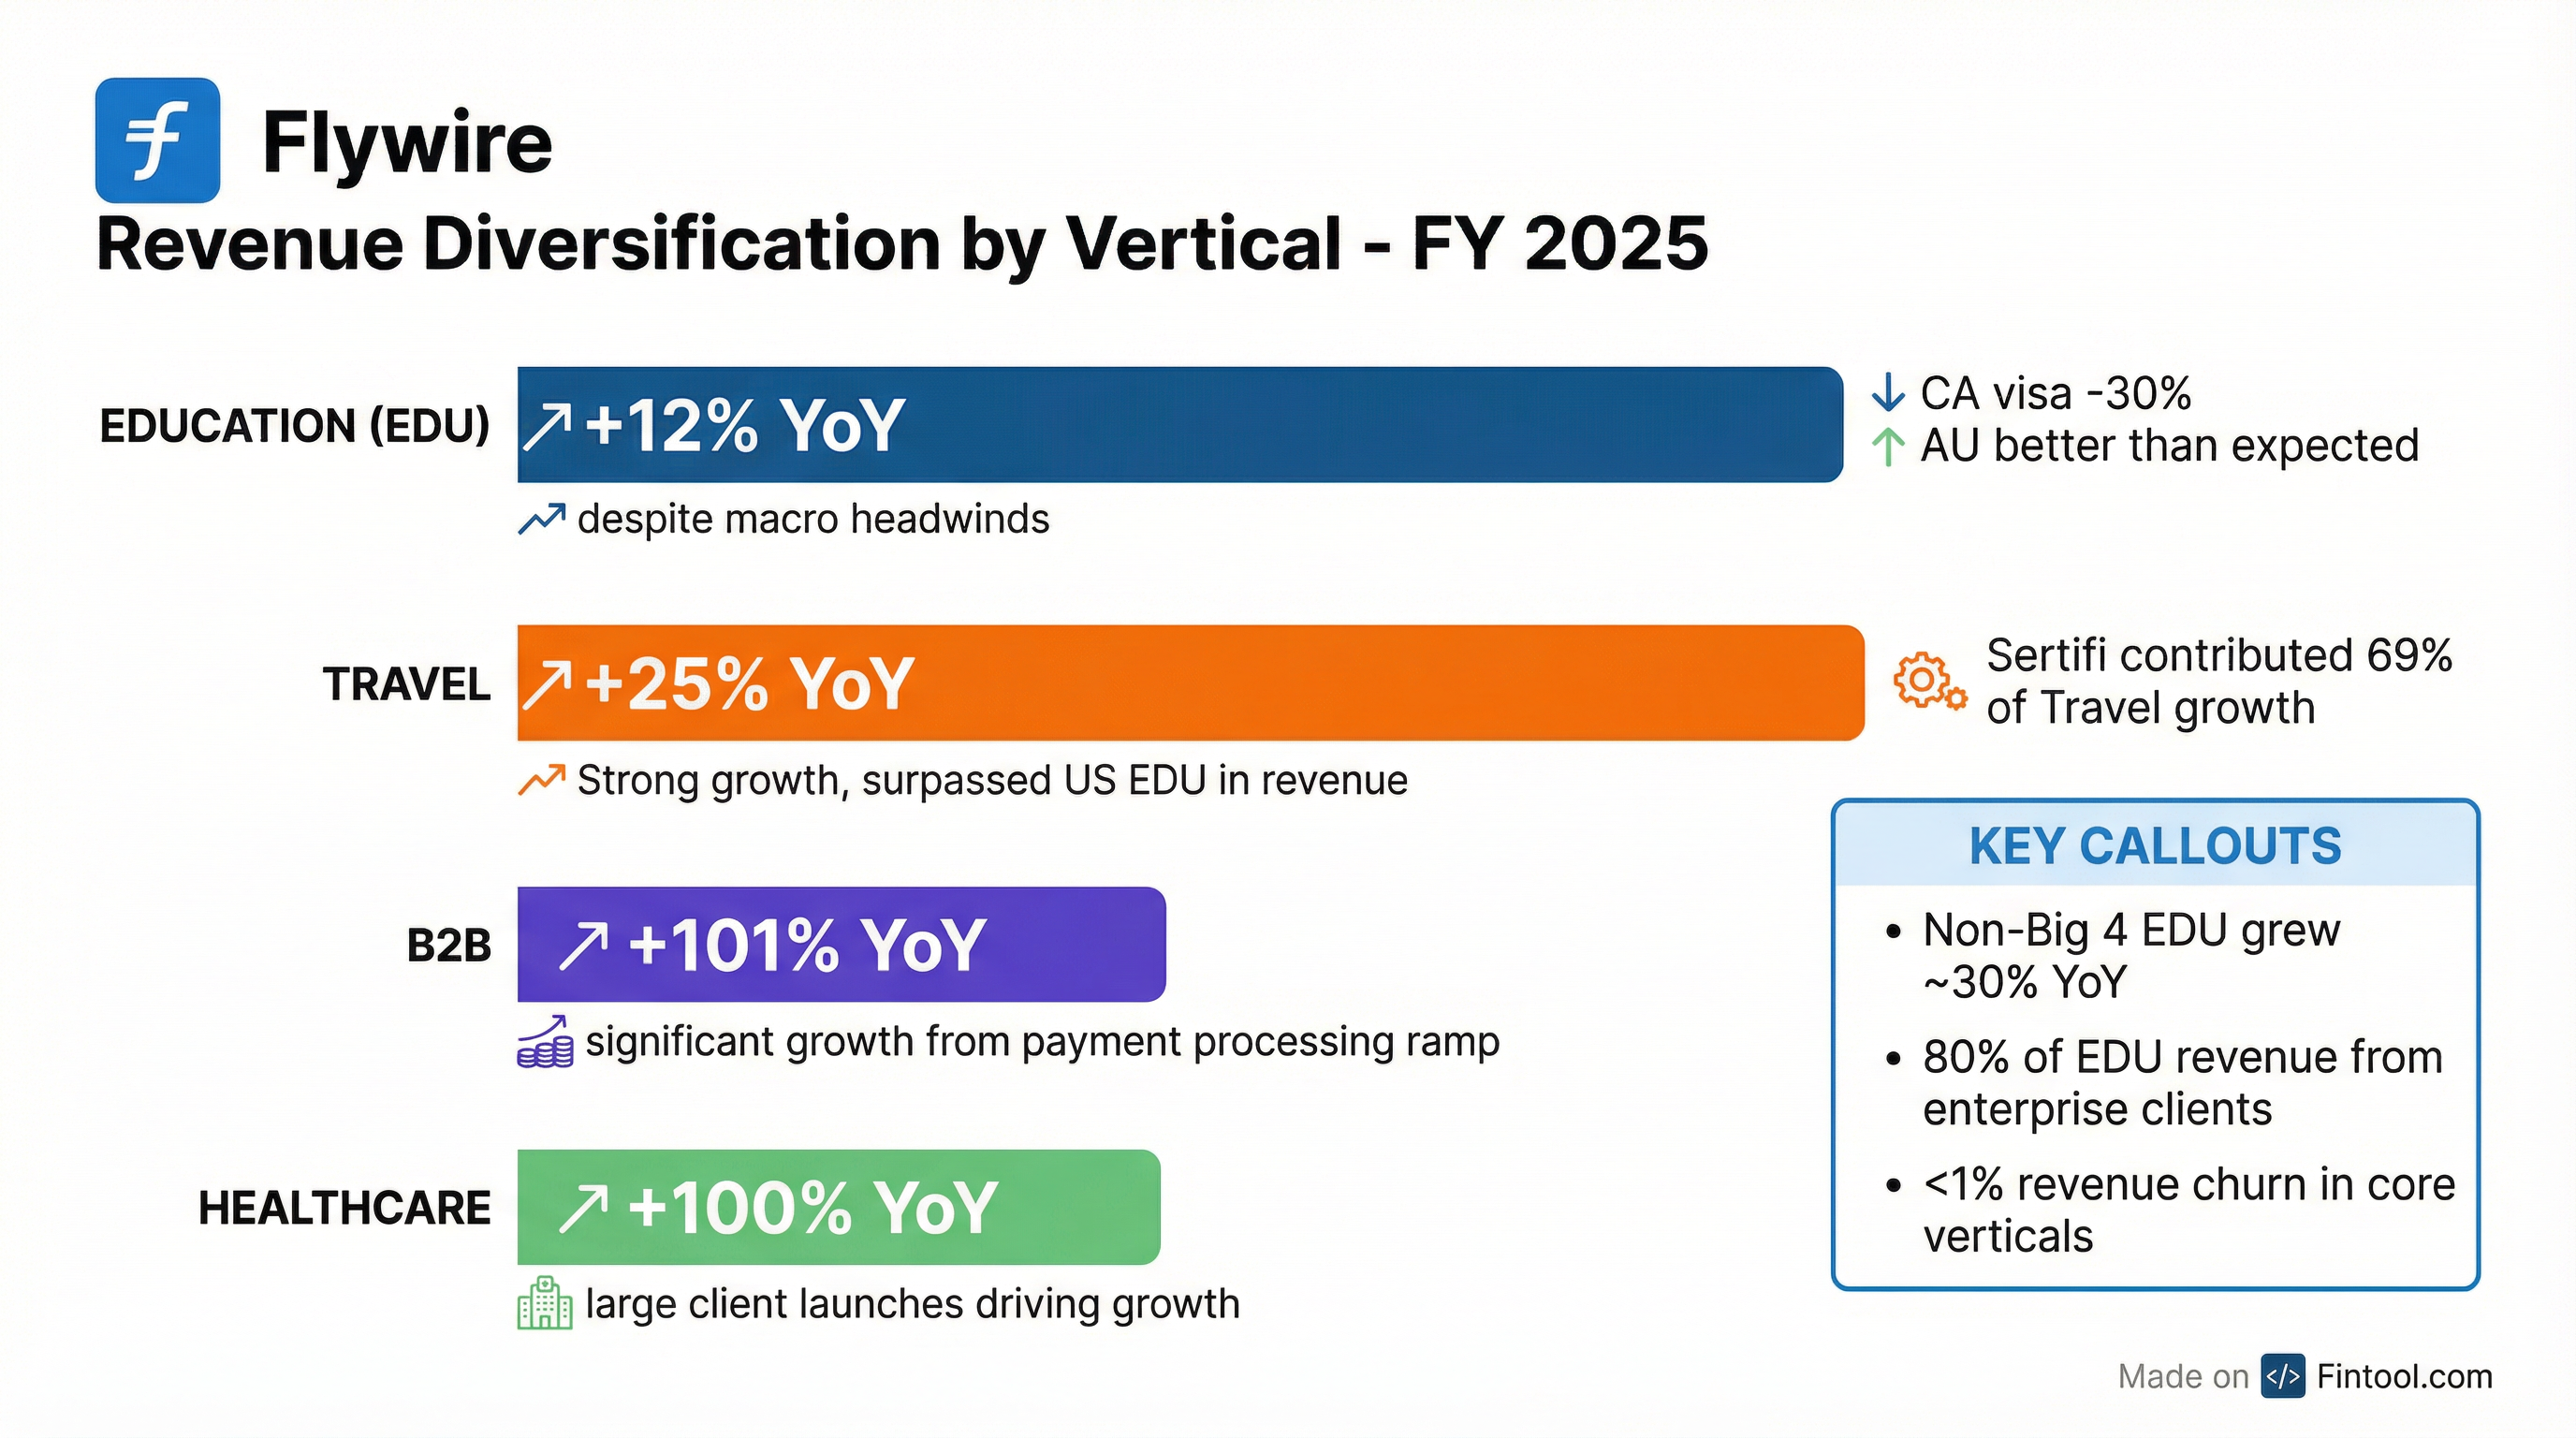
The vertical mix evolution is a key part of the Flywire investment thesis. FY 2025 showed significant diversification:
Enterprise concentration is high and sticky:
- 80% of Education revenue from enterprise clients (>$100K LTM revenue)
- 70% of Travel revenue from enterprise clients
- Sub-1% revenue churn in Education and Travel
Margins and Operating Leverage
Adjusted EBITDA margin expanded 190 bps YoY to 16.6% in Q4 and hit 20% for FY 2025 — a significant milestone.
Gross margin dynamics: Adjusted Gross Margin declined to 61.3% in Q4 (from 67.0% YoY) due to the mix shift toward lower-margin payment processing revenue in Healthcare and B2B. Management guided for 200-300 bps gross margin decline in FY 2026 from this ramp, normalizing to 100-200 bps annual decline exiting into 2027.
Operating leverage: Non-GAAP operating expenses as a percentage of RLAS have declined meaningfully:
- S&M: ~$120M spend vs ~$40M at IPO, but scaled more efficiently
- T&D: ~$50M vs ~$20M at IPO
- G&A: ~$95M vs ~$45M at IPO
The company is embedding AI across the development lifecycle to improve productivity and is consolidating systems to drive further leverage.
FY 2025 Full-Year Summary
The company achieved GAAP profitability for the full year with $13.5M in net income, benefiting from a $7.9M FX gain.
Risks and Considerations
Management flagged several headwinds in the guidance assumptions:
- US visa policy uncertainty — Expanded consular screening, H1B fee changes, social media reviews for highest-risk category
- Education macro pressure — Common App data shows applications for 2026-27 academic year down ~10%
- Australia tightening — Watching tighter visa requirements for Indian students
- Gross margin compression — 200-300 bps expected decline from payment processing mix shift
- Geopolitical risks — Tariff and immigration policy changes under new US administration
- Customer concentration — No single client >2% of revenue, but Education is still ~50% of mix
Key Takeaways
- Beat and raise quarter — Q4 beat on all metrics; FY26 guidance above expectations
- Diversification working — B2B (+101%), Healthcare (+100%) growing faster than Education
- Margin expansion intact — 20% FY25 Adj. EBITDA margin; 150-350 bps expansion guided for FY26
- Platform stickiness — Sub-1% revenue churn, Workday Certified status, deepening integrations
- Capital discipline — $15M debt paid off, $74M buybacks in FY25, $182M remaining authorization
- Leadership refresh — New CTO from Visa/PayPal brings scaling expertise